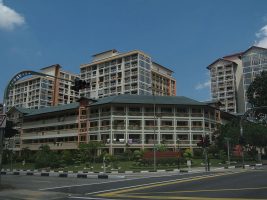
Serangoon 4 Room HDB Flat Average Resale Price Historical
Serangoon 4 Room HDB Flat Average Resale Flat Price From 2007 to 2022. I got the Data by referring to HDB Resale Flat Prices e-service,
The Chart below Shows the Serangoon HDB 4 Room Resale Flat Price ,it does not represent the HDB Prices for all Serangoon Area in general.For Area near MRT Station Prices might be way beyond Average. Whereas Area further from MRT Station Prices might be way below Average.
If you observe the Line Chart, Serangoon HDB 4 Room Resale Flat Price have inflated over the years
In Order to lessen the Burden of Home Buyers, Singapore Government have come out with Different CPF Housing Grant. for home owner to apply
- From (2007 to 2022) inflated 2.52 x Times
| Period | Prices |
|---|---|
| 1Q 2007 | 260000 |
| 2Q 2007 | 263000 |
| 3Q 2007 | 280000 |
| 4Q 2007 | 293000 |
| 1Q 2008 | 307500 |
| 2Q 2008 | 317500 |
| 3Q 2008 | 330000 |
| 4Q 2008 | 334000 |
| 1Q 2009 | 331000 |
| 2Q 2009 | 340000 |
| 3Q 2009 | 351000 |
| 4Q2009 | 362000 |
| 1Q 2010 | 370500 |
| 2Q 2010 | 387000 |
| 3Q 2010 | 395000 |
| 4Q2010 | 400000 |
| 1Q 2011 | 412000 |
| 2Q 2011 | 433000 |
| 3Q 2011 | 445000 |
| 4Q 2011 | 450000 |
| 1Q2012 | 448000 |
| 2Q 2012 | 453000 |
| 3Q 2012 | 462500 |
| 4Q 2012 | 475000 |
| 1Q 2013 | 481200 |
| 2Q 2013 | 48000 |
| 3Q 2013 | 468000 |
| 4Q 2013 | 468000 |
| 1Q 2014 | 457400 |
| 2Q 2014 | 456500 |
| 3Q 2014 | 445000 |
| 4Q 2014 | 435000 |
| 1Q 2015 | 420000 |
| 2Q 2015 | 425000 |
| 3Q 2015 | 424400 |
| 4Q 2015 | 420000 |
| 1Q 2016 | 423400 |
| 2Q 2016 | 423000 |
| 3Q 2016 | 428000 |
| 4Q 2016 | 430000 |
| 1Q 2017 | 423000 |
| 2Q 2017 | 435000 |
| 3Q 2017 | 430000 |
| 4Q 2017 | 430000 |
| 1Q 2018 | 429000 |
| 2Q 2018 | 431000 |
| 3Q 2018 | 425000 |
| 4Q 2018 | 426000 |
| 1Q 2019 | 430000 |
| 2Q 2019 | 425000 |
| 3Q 2019 | 425000 |
| 4Q 2019 | 430000 |
| 1Q 2020 | 460000 |
| 2Q 2020 | 495000 |
| 3Q 2020 | 530000 |
| 4Q 2020 | 565000 |
| 1Q 2021 | 593000 |
| 2Q 2021 | 598000 |
| 3Q 2021 | 615000 |
| 4Q 2021 | 625000 |
| 1Q 2022 | 657000 |
| 2Q 2022 | 635000 |
| 3Q 2022 | 645000 |
| 4Q 2022 | 656000 |
Check out Serangoon 3 Room HDB Flat Average Price Here
