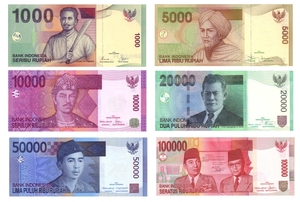
Indonesian rupiah Rp Inflation Calculator
The Indonesian Rupiah Inflation Calculator will measures the buying power of the Indonesia Rupiah from 1969 to 2021
- Select the Starting Year
- Select the Ending Year
- Click Calculate
Indonesia Inflation History Data
Source from world Bank
| No | Year | Inflation Rate |
|---|---|---|
| 1 | 1969 | 16.52 |
| 2 | 1970 | 12.47 |
| 3 | 1971 | 4.24 |
| 4 | 1972 | 6.55 |
| 5 | 1973 | 31.15 |
| 6 | 1974 | 40.94 |
| 7 | 1975 | 19.19 |
| 8 | 1976 | 19.91 |
| 9 | 1977 | 11.10 |
| 10 | 1978 | 8.16 |
| 11 | 1979 | 16.16 |
| 12 | 1980 | 18.16 |
| 13 | 1981 | 12.44 |
| 14 | 1982 | 9.45 |
| 15 | 1983 | 11.79 |
| 16 | 1984 | 10.49 |
| 17 | 1985 | 4.72 |
| 18 | 1986 | 5.82 |
| 19 | 1987 | 9.28 |
| 20 | 1988 | 8.07 |
| 21 | 1989 | 6.42 |
| 22 | 1990 | 7.8 |
| 23 | 1991 | 9.42 |
| 24 | 1992 | 7.59 |
| 25 | 1993 | 9.67 |
| 26 | 1994 | 8.52 |
| 27 | 1995 | 9.43 |
| 28 | 1996 | 8.01 |
| 29 | 1997 | 6.21 |
| 30 | 1998 | 58.01 |
| 31 | 1999 | 24.03 |
| 32 | 2000 | 3.74 |
| 33 | 2001 | 11.47 |
| 34 | 2002 | 11.96 |
| 35 | 2003 | 6.78 |
| 36 | 2004 | 6.06 |
| 37 | 2005 | 10.40 |
| 38 | 2006 | 13.34 |
| 39 | 2007 | 6.40 |
| 40 | 2008 | 10.21 |
| 41 | 2009 | 4.45 |
| 42 | 2010 | 5.12 |
| 43 | 2011 | 5.38 |
| 44 | 2012 | 4.28 |
| 45 | 2013 | 6.4 |
| 46 | 2014 | 6.42 |
| 47 | 2015 | 6.38 |
| 48 | 2016 | 3.53 |
| 49 | 2017 | 3.81 |
| 50 | 2018 | 3.2 |
| 51 | 2019 | 3.06 |
| 52 | 2020 | 2.03 |
| 53 | 2021 | 1.56 |
Check out Thai Baht Inflation Calculator Here
